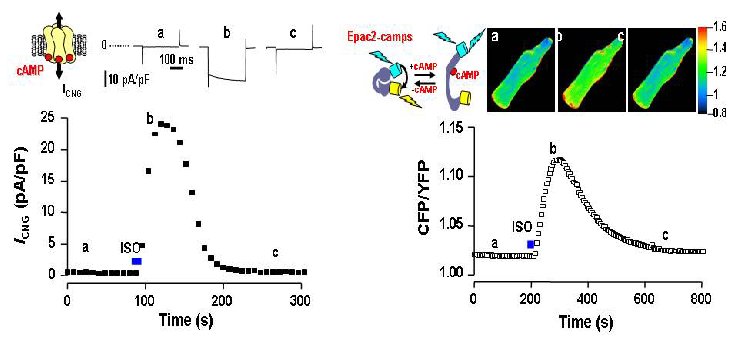
Figure 2: Compartmentalized cAMP signals elicited by a pulse stimulation with the β-adrenergic agonist isoprenaline (Iso, 100 nM, 15 s.) in an adult rat ventricular myocyte. Left: patch clamp recording of engineered CNG channel current measuring cAMP signals at the membrane. Lower graph represents the time course of CNG current amplitude and upper traces show individual ICNG current traces recorded at the time indicated by the letters on the lower graph. Right: cAMP imaging by the FRET-based cytosolic sensor Epac2-camps. Lower graph represents the time course of CFP/YFP ratio and upper pseudocolor images of the spatial distribution of cAMP at the times indicated by the letters on the lower graph. (from Leroy et al., 2008 Circ Res)